Rebellion acquires influential Tunnels & Trolls roleplaying game

Full Statement from Rebellion
World-renowned independent creative studio Rebellion is delighted to announce the acquisition of Tunnels & Trolls, one of the trailblazing games of the fantasy genre, and the second roleplaying game ever published.
First published in 1975 by Flying Buffalo as a more player-friendly alternative to Dungeons & Dragons, Tunnels & Trolls introduced roleplaying to new audiences through its streamlined mechanics and pioneering approach to solo roleplaying. Now, almost 50 years after its original publication, the Rebellion Unplugged team is bringing Tunnels & Trolls into a new era.
“Tunnels & Trolls is an unrecognised trailblazer in the games industry”, said Duncan Molloy, head of Rebellion Unplugged. “The team at Flying Buffalo responded to an entirely new medium by focusing on how roleplaying could be more approachable, more accessible, and more fun. So much of the modern era of roleplaying from old school hacks, to streamlined systems, to solo play, can directly trace its roots directly back to this series. We’re very excited to channel that spirit in bringing Tunnels & Trolls into the modern era.”
“When I first discovered Tunnels & Trolls in the mid-1970s, I didn’t realize I was unlocking a life-long interest in fantasy roleplaying games, books, movies, and all things genre-based” recalled Rebellion CEO and Creative Director Jason Kingsley OBE, “The game has remained with me throughout my life, and I can’t wait to see what the team have in store for it!”
After the passing of Flying Buffalo founder Rick Loomis, the company had been taken over by Webbed Sphere Inc. “We are very excited to see Rebellion expand this rich property” added Jon Huston, president of Webbed Sphere. “As a long-time fan, I always felt that the Flying Buffalo roleplaying lines had such incredible potential.”
As part of the acquisition Rebellion have taken over Flying Buffalo’s entire line of roleplaying games, including the cult classic Citybook, Grimtooth, and Mercenaries, Spies and Private Eyes series. The entire back-catalogue of Flying Buffalo PDFs will remain available to purchase online, with future releases coming directly from Rebellion Unplugged.
A Message from CEO Jason Kingsley
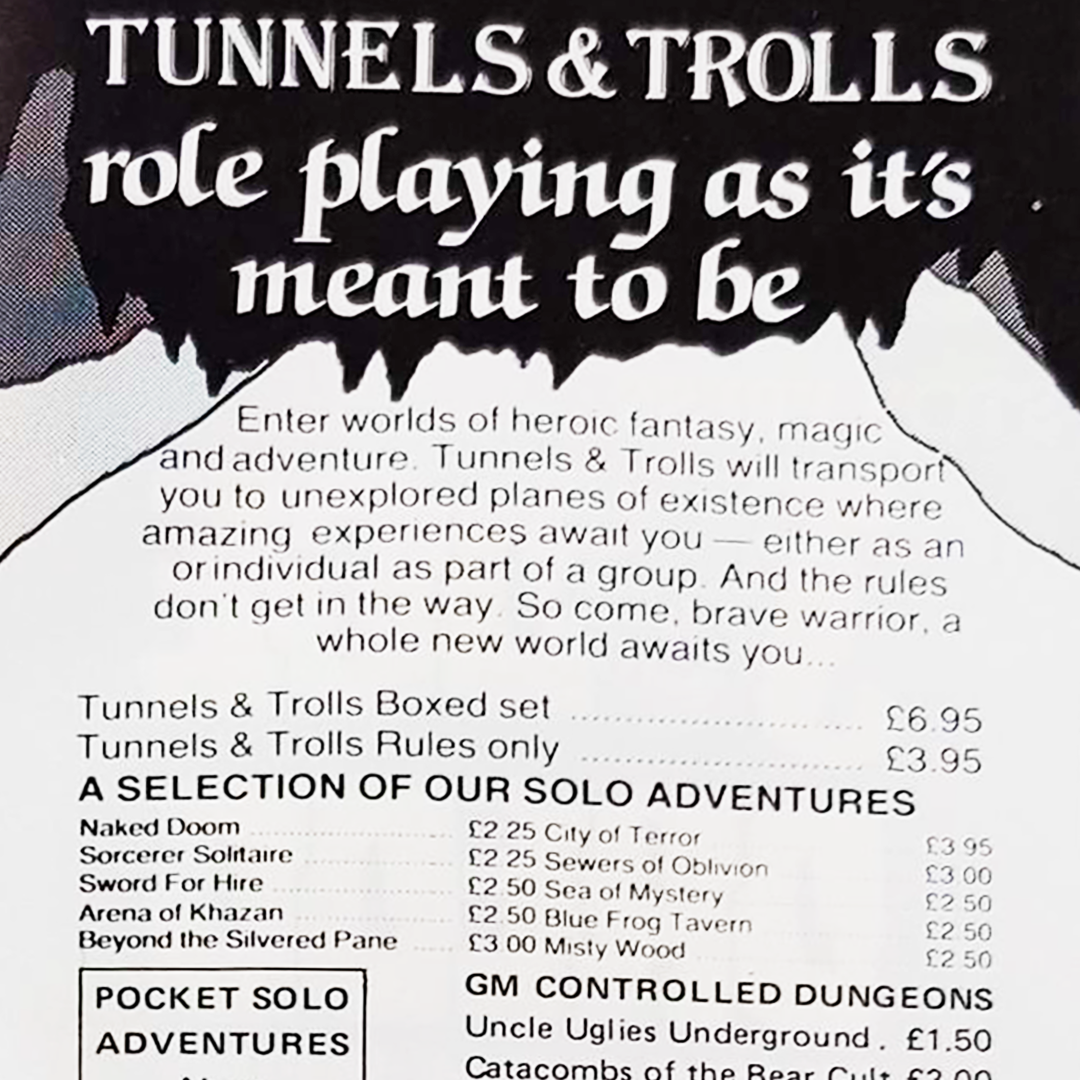
My first encounter with Tunnels & Trolls was an ad in the back of a wargaming magazine that I was reading in the school library. The game promised brave new worlds of heroic fantasy, magic, and adventure – an exciting proposition that was enough to convince me to fill out the order form, send off my postal order, and wait (somewhat) patiently for it to arrive.
28 days later, I received a package containing a yellow book with black tape binding – the Tunnels & Trolls rulebook. It wasn’t hard to convince some friends to give it a go, and before long I was spending my weekend drawing out dungeon plans, inventing new monsters, and heading out on adventures. With its rich, accessible ruleset, Tunnels & Trolls gave me all the tools I needed to create the fantasy world that I wanted for me and my friends to get lost in.
It was my first introduction to roleplaying games, and I was hooked.
I still have fond memories of some of my favourite characters, decades after I first conceived them. There was Basalneep the Mysterious, a powerful wizard with suspiciously spidery legs protruding from under his floor-length gowns and a surprising mastery of the immobilisation spell Glue You. Or my part-elf wanderer Jelf Foamkestrel, a friend of many unusual animals, and whose name concisely and so very well conveys the tone of game. There were countless others beyond them, many of whom met their grizzly end playing through the vast range of Tunnels & Trolls solo adventures, while others fell to some particularly challenging monsters of my friends’ creation.
Tunnels & Trolls will always hold a special place in my heart. It sparked a lifelong interest in roleplaying, and fed into my love of the fantasy genre which has stuck with me to this day. I’m delighted to bring it into the Rebellion, and can’t wait for the new adventures from the Unplugged team.
Tunnels & Trolls Acquisition FAQs
Who are Rebellion?
Rebellion is one of the world’s most successful independent creative studios, producing video games, books, comics, tabletop games, TV, film, and more.
Rebellion Unplugged is a small team of tabletop industry veterans who form Rebellion’s tabletop division. You might know us from the critically acclaimed Sniper Elite board game, or the RPG anthology series Adventure Presents.
What will happen with Tunnels & Trolls at Rebellion?
We are actively working on the next chapter of Tunnels & Trolls releases. That’s all we can say right now, but if you want to make sure you always hear the latest news on Tunnels & Trolls be sure to subscribe to our newsletter.
Will the new content be compatible with my Tunnels & Trolls books?
Exactly how the new content of Tunnels & Trolls will look and play is still work in progress. What we can say is that at every step of development we’re considering how the new plans we have in store will integrate with the parts you already love, whether it’s your favourite player character or your most well-thumbed solo adventure book.
Can I still get old issues of Tunnels & Trolls?
The entire back-catalogue of Flying Buffalo RPGS remain available to buy at Drive Thru RPG.
Will I be able to publish my fan-made Tunnels & Trolls contents in the future?
Yes, absolutely. The fans of Tunnels & Trolls are core to its enduring legacy, and we are keen to make sure they remain active participants in the game. We’re still in the very early stages of planning, and will be putting a call out to creators later this year. Subscribe to the newsletter or our social channels if you’re interested, as that’s where we’ll be talking about it first.
Is there anything you can tell us?
There’s going to be a new edition, and it’s going to be fun.
Buy the Classic Game